Visualizing Bitcoin Network Stress: A Hilbert Heatmap of the October 10, 2025 Liquidation

In just two hours, with zero prior experience and some guidance from AI, I built a full Bitcoin network visualization from scratch. The result? A Hilbert heatmap showing how the network reacted during the massive liquidation on October 10, 2025.
Capturing the Network
Bitcoin nodes are spread across the globe, each representing an active participant in the decentralized network. Using Bitnodes, I accessed snapshots of the network from the event day. Filtering only valid IPv4 addresses, I ignored .onion addresses and other non-standard endpoints. The nodes were then aggregated into /16 subnets, giving a clear picture of where network activity was concentrated.
From Subnets to Heatmap
I employed a Hilbert curve, a space-filling curve that maps 1D data into 2D while preserving locality, to visualize the network. Each subnet was converted into a Hilbert index, producing a heatmap where intensity reflects the number of nodes in that segment.
Insights from the Crash
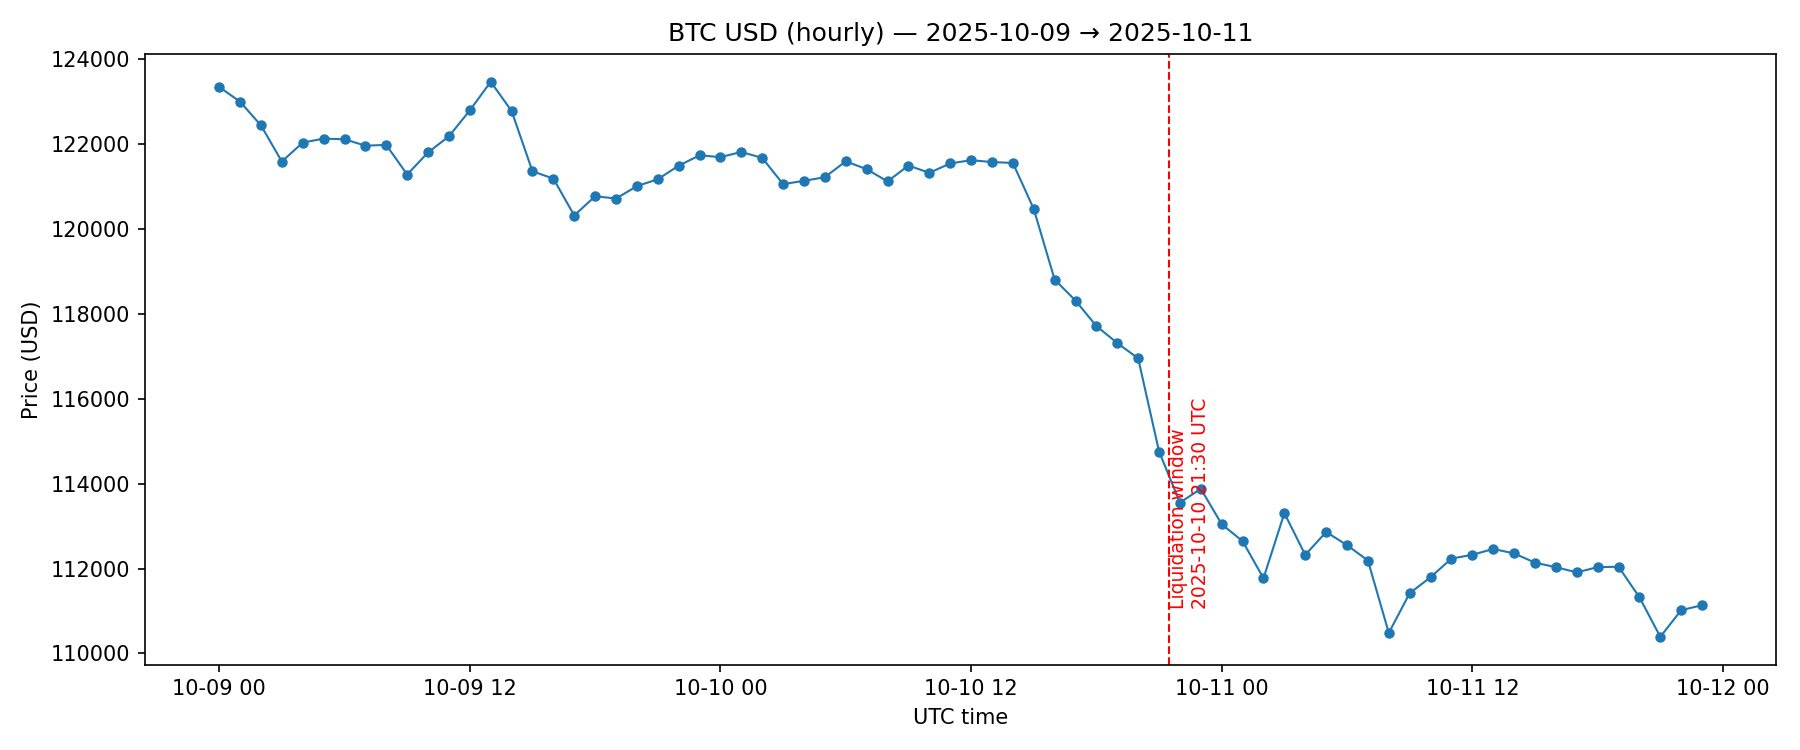
Overlaying Bitcoin price data on the heatmap revealed network stress patterns during the sell-off. Certain subnets lit up, suggesting that nodes in specific regions or ISPs reacted faster to market movements. This network-level perspective adds context that price charts alone can’t provide.
Why It Matters
This experiment shows what’s possible when AI accelerates learning and execution. In two hours, I went from zero knowledge to generating a professional-grade network visualization that could be used for research, trading insights, or blockchain infrastructure analysis.
The Code
Everything was done in Python, using libraries like requests, pandas, numpy, matplotlib, and hilbertcurve. The scripts are modular, repeatable, and can recreate snapshots from any date, enabling deep dives into past Bitcoin network events

.Pixels = /16 subnets (65k IPs each)
Brightness = number of active nodes (not humans)
Clusters = infrastructure pillars (exchanges, mining pools, cloud nodes)
Spikes during events = network activity reflecting major market moves, like the Oct 10 liquidation